
Infrastructure projects in the North Eastern States of India are primarily carried out under the Non Lapsable Central Pool of Resource (NLCPR) scheme directly located under the Ministry of Development of North Eastern Region. Objective of the scheme is to fill the gap in the infrastructure sector of the North East Region by sanctioning the projects prioritised through the respective state governments. The construction and maintenance of roads and bridges (apart from National Highways) too is sanctioned by the NLCPR scheme.
The below infographic shows the existing length of National Highways in eight states of Northeast India along with related measures of expenditure by the Ministry of Road Transport and Highways, Length in km/1000 sq km and Length in km/100,000 population.
One of the interesting things to note here is that although Assam ranks first in the absolute length of National Highways with a total length of 3909 km, it ranks second last in terms of length per 1000 sq km at 49.80km/1000 sq km and last in terms of length per 100,000 people at just 12.5 km/100,000 people.

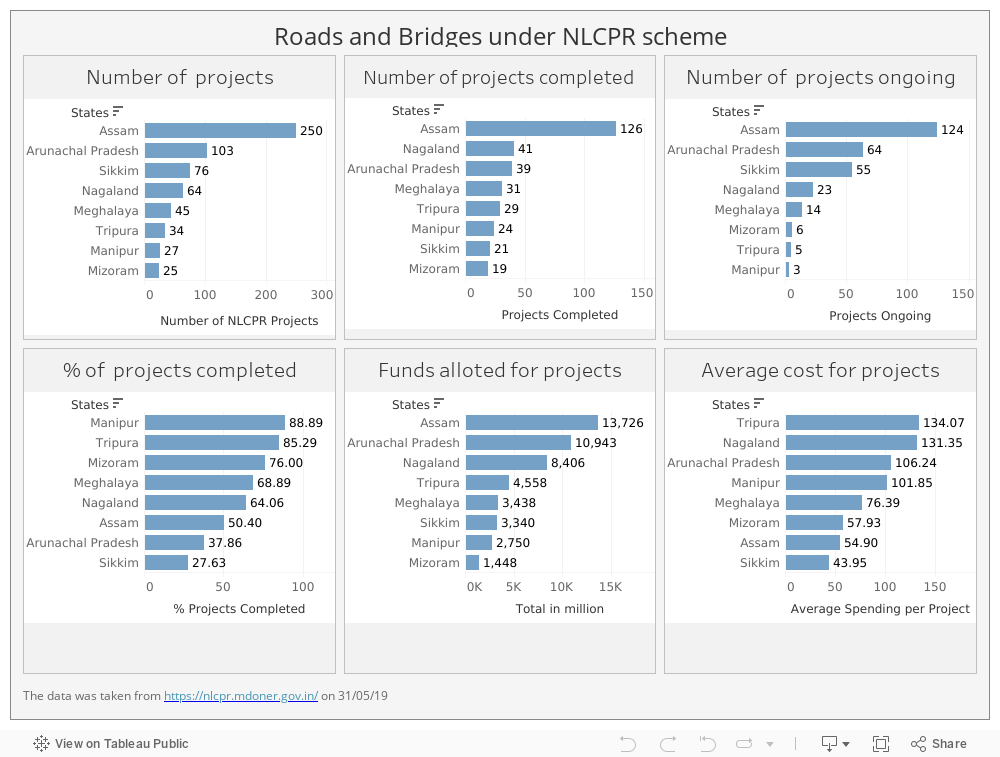
The below infographic focuses specifically on the Roads and Bridges constructed and maintained under NLCPR scheme. As of May 2019, 577 projects worth ₹ 64,664 million have been approved for construction under NLCPR. The number of projects in each state, the number of projects completed, expenditure involved and other related parameters are also shown.
One of the interesting things to note here is the state of Arunachal Pradesh. The average cost for each project in Arunachal Pradesh is quite high at ₹ 106.24 million and hence the total funds allotted too are huge at ₹ 10,943 million. However, of its 103 projects started since the year 2000, only 39 projects or 37.86 % have been completed. The incomplete projects are mostly the recent ones as further shown in the final infographic.
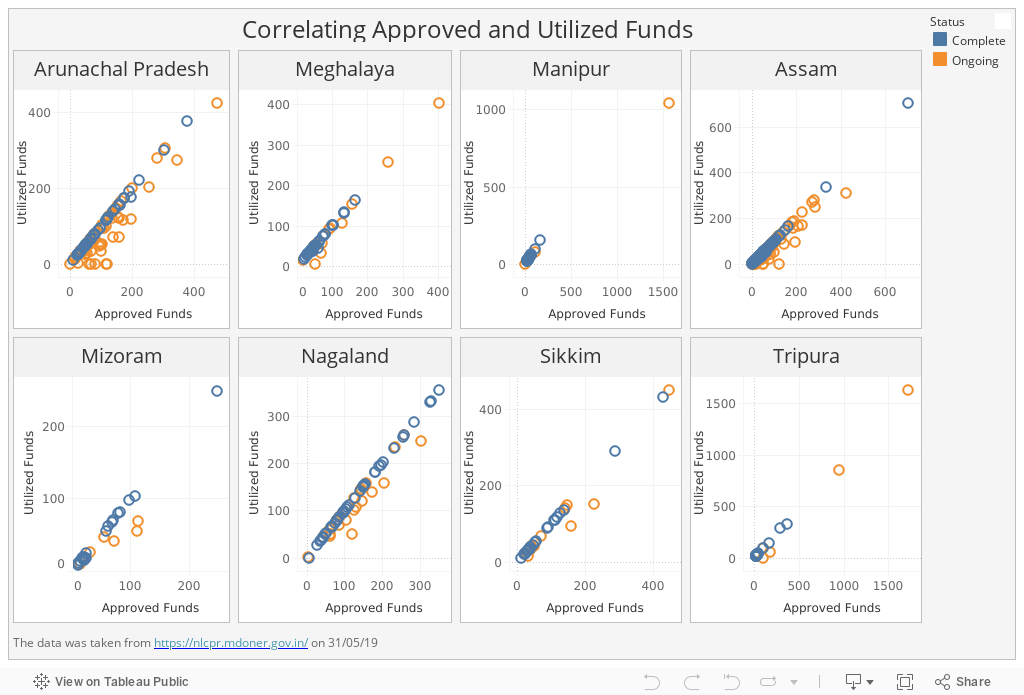
The below infographic is a state wise correlation chart between approved and utilised funds. The blue circles are the completed projects while the orange circles are the incomplete projects. If one looks at the state of Assam, one can see that a considerable number of orange circles lie on or near the 45 degrees line. This means that although the executive agency has used up all or almost all of the approved funds, the project is still incomplete. Similarly is the case for the state of Arunachal Pradesh.
The below Gantt chart shows each NLCPR project in detail. The name of the project is shown along the Y-axis and the projects are arranged according to their approval date. Green and Red colors of the bars indicate complete and incomplete projects respectively. The lighter shades of green and red indicate the actual date of completion and the ongoing nature of the project respectively. Hovering over any bar brings up a tooltip showing details like approved cost of the project and the amount utilised towards building the project as well as the scheduled date of completion and the actual date of completion.

Original Author: Ashish Khandalikar. All rights reserved.